Kubesphere 클러스터 설치 (수정 중)
- 설치 요구 사항 (See Prerequisites site)
- Kubesphere 설치를 위한 준비 작업 (See Prerequisites site)
- Kubesphere 설치 방법
- Air gapped Installation
- Direct installation
요구 사항
- 현재 KubeSphere Major 버전은 3.3으로 Kubernetes 클러스터의 버전은 v1.20.x, v1.21.x, v1.22.x, v1.23.x, 또는 v1.24.x 이어야 한다
쿠버네티스1.22 버전부터는 비호환성으로 인해 edge node의 일부 기능을 사용할 수 없다. 따라서 edge node를 사용하려면 Kubernetes v1.21.x 를 설치하는 것이 좋다.
edge node는 클러스터 컴퓨팅에서 다른 노드와의 통신을 위한 최종 사용자 포털/게이트웨이 역할을 하는 노드이다.
- x86_64 CPU만 지원되며, ARM CPU는 현재 완전히 지원되지 않는다
- Kubernetes 클러스터에 기본 StorageClass가 구성되어 있어야 한다.
kubectl get sc명령어를 사용하여 클러스터의 StorageClass 상태를 확인한다. 추가로 StorageClass는 Default class에 속 해야 한다.
Storage Class는 PV(Persistent Volume)을 동적으로 프로비저닝하기 위한 스토리지 유형과 해당 속성을 정의하는 구성.
- CSR Signing 관련 (아직 confirm 되지 않았으나 나중에 이게 필요하면 추가)
KubeSphere 설치를 위한 준비 작업
쿠버네티스 클러스터 생성 작업은 이미 수동과 자동 방법으로 Wiki에 추가 되어있다.
바로가기:
클러스터가 준비 된 후, Kubernetes 클러스터에 기본 StorageClass를 구성해야 한다.
Kubernetes v1.24 이상이면 특정 Kubesphere 서비스가 실행 되지 않으니 주의 할 것!
(현재 KubeSphere는 Default SC만 있어도 설치가 가능 하고, PV및 PVC각각 요소들이 있을때와 없을때의 KubeSphere 차이를 테스트 해보아야 한다.) 왜냐면 현재 Prometheus Monitoring이 활성화 되지 않고 있기 때문이다.
StorageClass ready:
mkdir Volume && cd Volume

vi storage.yml

apiVersion: storage.k8s.io/v1
kind: StorageClass
metadata:
  name: my-storage-class
  annotations:
    storageclass.kubernetes.io/is-default-class: "true"
provisioner: kubernetes.io/no-provisioner
volumeBindingMode: WaitForFirstConsumer
vi pv.yml
apiVersion: v1
kind: PersistentVolume
metadata:
name: my-pv
spec:
capacity:
storage: 20Gi
accessModes:
- ReadWriteOnce
persistentVolumeReclaimPolicy: Retain
storageClassName: my-storage-class
hostPath:
path: /dev/sdb[root@node1 Volume]# kubectl apply -f storage.yml
storageclass.storage.k8s.io/my-storage-class created
[root@node1 Volume]# kubectl apply -f pv.yml
persistentvolume/my-pv created
[root@node1 Volume]# kubectl get pv
NAME CAPACITY ACCESS MODES RECLAIM POLICY STATUS CLAIM STORAGECLASS REASON AGE
my-pv 20Gi RWO Retain Available my-storage-class 3s
[root@node1 Volume]# kubectl get sc
NAME PROVISIONER RECLAIMPOLICY VOLUMEBINDINGMODE ALLOWVOLUMEEXPANSION AGE
my-storage-class (default) kubernetes.io/no-provisioner Delete WaitForFirstConsumer false 10s
[root@node1 Volume]# kubectl apply -f storage.yml
storageclass.storage.k8s.io/my-storage-class created
[root@node1 Volume]# kubectl apply -f pv.yml
persistentvolume/my-pv created
[root@node1 Volume]# kubectl get pv
NAME CAPACITY ACCESS MODES RECLAIM POLICY STATUS CLAIM STORAGECLASS REASON AGE
my-pv 20Gi RWO Retain Available my-storage-class 3s
[root@node1 Volume]# kubectl get sc
NAME PROVISIONER RECLAIMPOLICY VOLUMEBINDINGMODE ALLOWVOLUMEEXPANSION AGE
my-storage-class (default) kubernetes.io/no-provisioner Delete WaitForFirstConsumer false 10s
KVM에 설치 후:
로그 파일

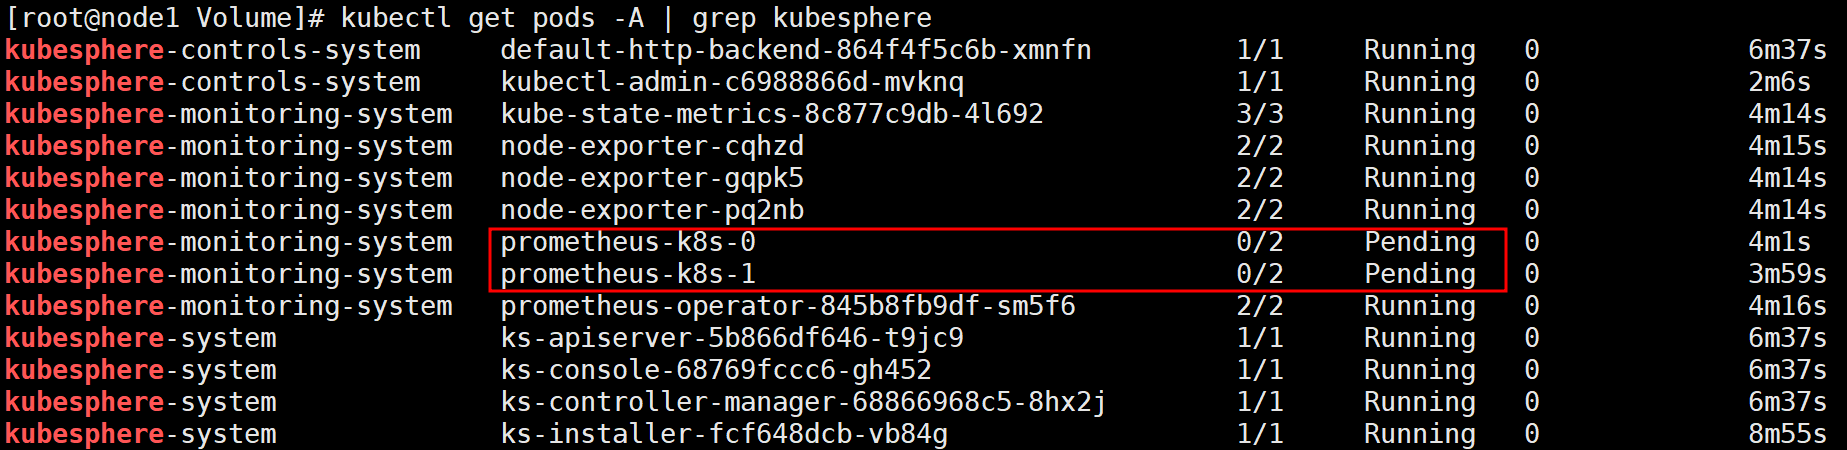
kubesphere파드 상태

VMWare Local 에서 시도:
Same for VM we get Prometheus failure
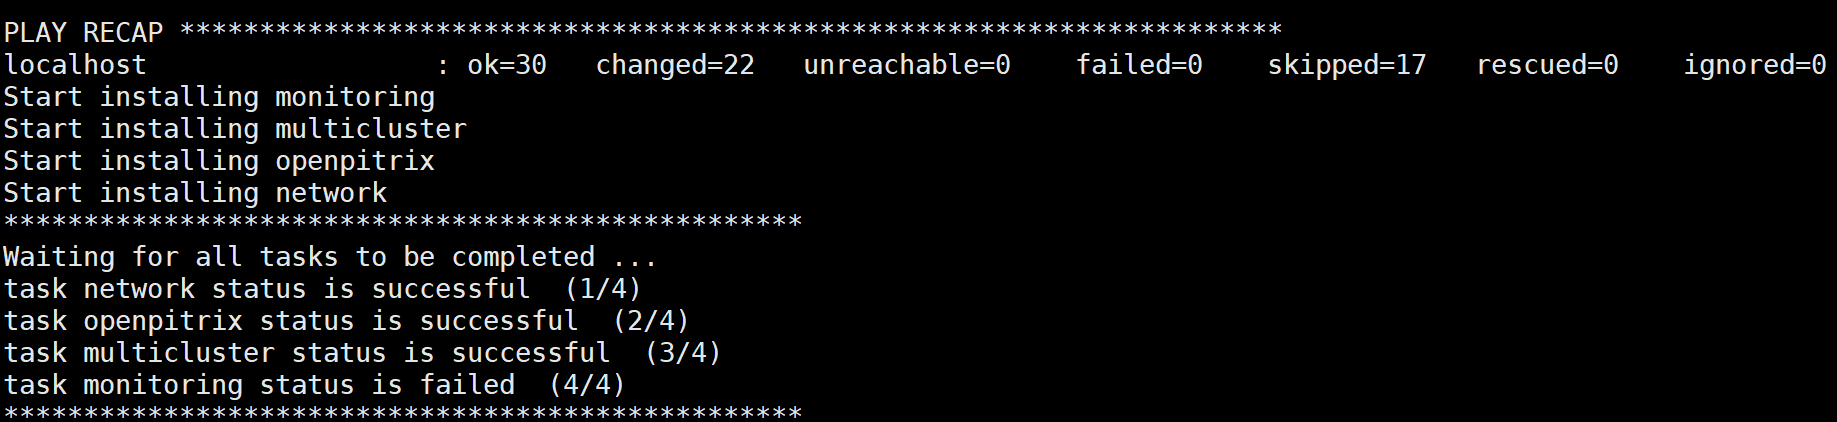
As Monitoring status failed, we can see
June 26 update:
As there was an issue with the monitoring system with k8s v1.26, I switched to k8s v1.24.6 and then installed KubeSphere. To which I got

So it was a version issue. But if we check through CLI, we still get the Pending state for the monitoring system

So I Have set up a storage class (default) and a pv so that prometheus can use it.
kubectl get pv
NAME    CAPACITY   ACCESS MODES   RECLAIM POLICY   STATUS   CLAIM                                                             STORAGECLASS       REASON   AGE
my-pv   20Gi       RWO            Retain           Bound    kubesphere-monitoring-system/prometheus-k8s-db-prometheus-k8s-0   my-storage-class            21m

kubectl get pvc -A
NAMESPACE                      NAME                                 STATUS   VOLUME   CAPACITY   ACCESS MODES   STORAGECLASS       AGE
kubesphere-monitoring-system   prometheus-k8s-db-prometheus-k8s-0   Bound    my-pv    20Gi       RWO            my-storage-class   14m
The problem is that the pod looks like this currently
kubectl get pods -n kubesphere-monitoring-system
NAME                                               READY   STATUS                       RESTARTS   AGE
alertmanager-main-0                                2/2     Running                      0          20m
kube-state-metrics-6f6ffbf895-c28hf                3/3     Running                      0          20m
node-exporter-22fdn                                2/2     Running                      0          20m
node-exporter-96gmd                                2/2     Running                      0          20m
notification-manager-deployment-77d5b49896-9lt48   2/2     Running                      0          18m
notification-manager-operator-66c6967d78-bj2ms     2/2     Running                      0          19m
prometheus-k8s-0                                   1/2     CreateContainerConfigError   0          20m
prometheus-operator-b56bb98c4-l4cvp                2/2     Running                      0          20m
But we can easily go to Web ui.

We can see that the ks console is running on 30880 port with a nodeport svc type so we can basically use any ip of our cluster nodes with the port number.
The result:

The default credentials is:
admin/P@88w0rd
After initial login we can see

After logging in,

We can see the on the top left corner, there is a 'platform' option. Upon clicking that we will be greeted with:

If we check 'cluster management':

If we check our nodes:

We can see that our K8s cluster nodes can be seen. The monitoring screen can also be accessed and many other features are available.